statistics multiple choice questions 1-18
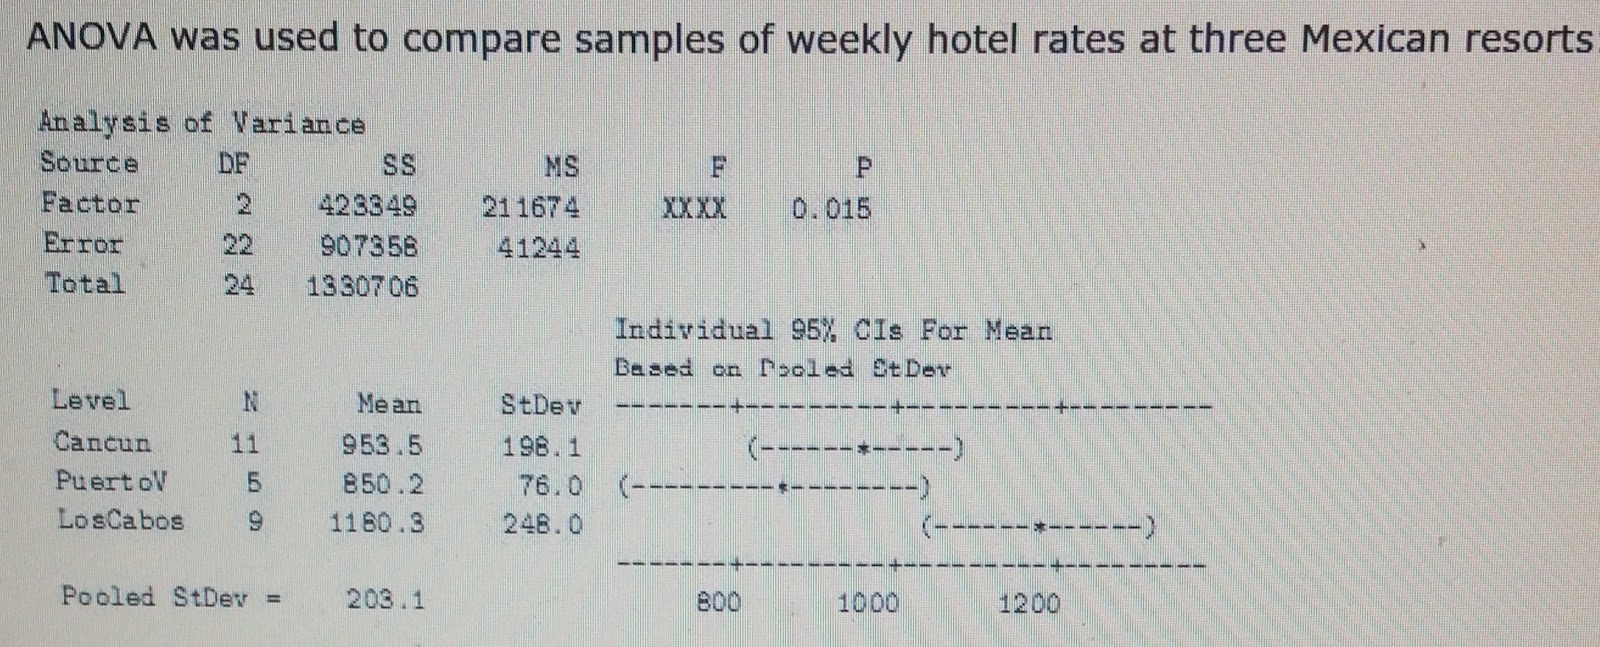
18.) What does the alternative hypothesis state?
-
A three population means are different
-
Not all of the population means are different
-
Not all of three population means are the same
17.) What does the null hypothesis state?
-
X1=X2=X3
-
1=2=3
16.) Which of these best describes the relative rates?
-
One of the resorts was much cheaper than the other two
-
One of the resorts was much more expensive than the other two
-
All three resorts’ rates were quite similar
15.) A sleep lab study found that a group of subjects with a mean age of about 68 years slept significantly less than the group of subjects with a mean age of 22 years, with the former averaging only 7.4 and the latter 8.9 hours. In contrast, an ANOVA procedure on student survey data found no significant difference in hours slept among 1st, 2nd, 3rd, and 4th year students. in general, to produce evidence of a relationship between sleep and age, which is more helpful?
-
include individuals who are all roughly the same age.
-
include individuals spanning a wide range of ages.
-
it doesn’t matter how similar or different the ages are.
14.) students compare tuition, in thousand of dollars, for samples of public and private colleges/universities in the US.
|
N |
Mean |
St. Dev |
SEMean |
|
|
Public |
5 |
7.26 |
1.48 |
0.66 |
|
Private |
6 |
32.32 |
3.30 |
1.3 |
Difference = public – private
Estimate for differences: -25.06
T- test of difference =0 (vs, not =): T-value = XXXX P-Value = 0.000 DF=7
-
paired study
-
Two-sample study
-
Both of the above
-
None of the above
13.) Each student in a class of 80 rolls 8 dice in order t perform inference about the mean of all dice rolls (which happens to be 3.5). Suppose each student uses his or her sample to test the true null hypothesis that the population mean is 3.5 against the two-sided alternative. About how many of these 80 test should reject at the =0.05 level?
-
0
-
4
-
8
-
28
-
52
12.) A Type I Error is rejecting the null hypothesis, even though it is true; a Type II Error is falling to reject the null hypothesis, even though it is false.
Merck developed an AIDS vaccine that showed promise in initial test. Unfortunately, in a subsequent test conducted internationally on a large group of volunteers, those vaccinated were no less likely to become infected than those who were not vaccinated. Apparently, Merck’s conclusion in the initial tests was
-
a Type I Error
-
a Type II Error
-
both (a) and (b)
-
neither (a) nor (b)
11.) Online interviews of 1500 parents with children under the age of eight found the proportion who read to their children at least 20 minutes a day to be 0.78. Suppose a reporter would like to claim that more than three-fourths (0.75) of all parents with children under eight read to them at least twenty minutes daily.
What notation is used for the number 0.75?
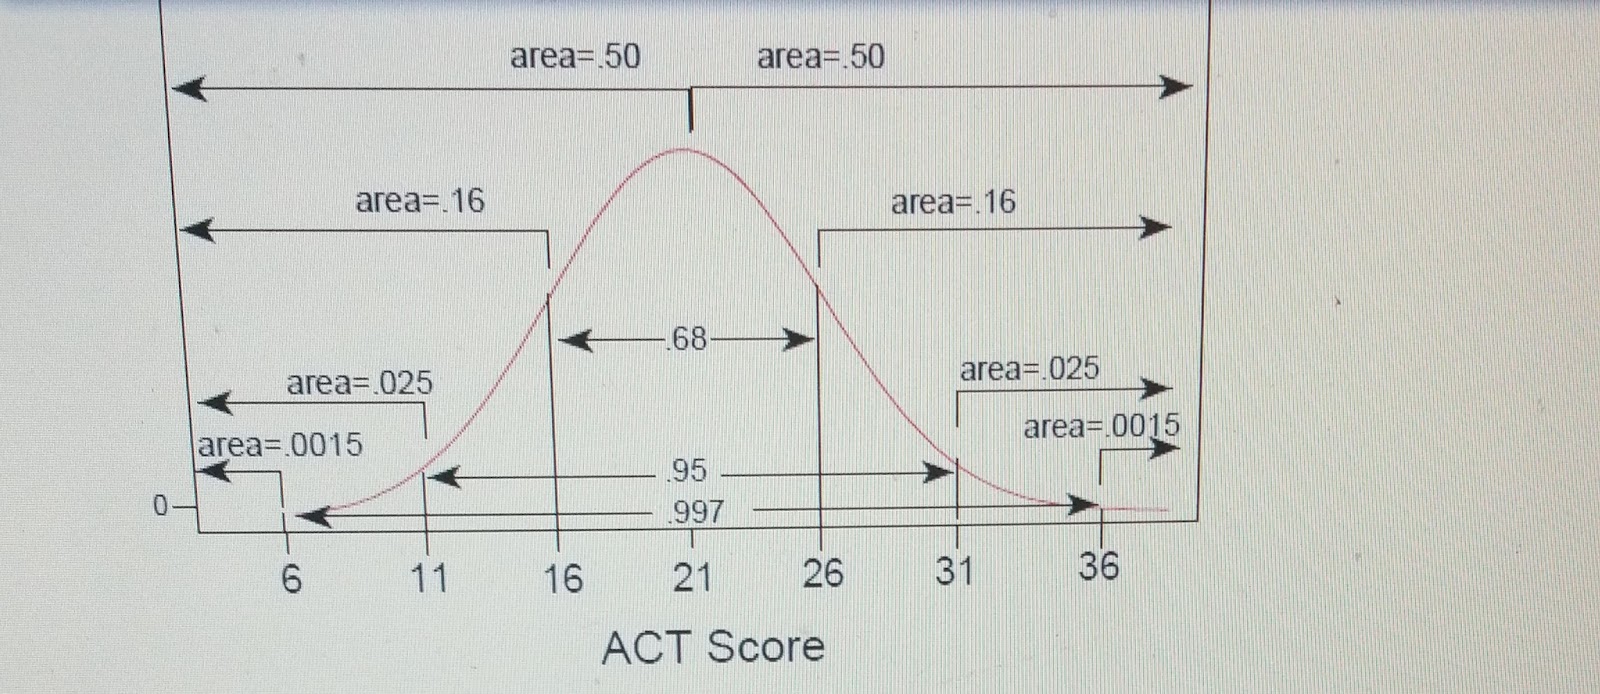
10.) which of these is your best guess for the probability of a score being greater than 30?
-
0.016
-
0.036
-
0.16
-
0.36
9.) The probability of birth by Caesarean in the U.S. is 0.30
If the probability of Caesarean birth is 0.30, and 140 in a sample of 500 births are Caesarean, which of these numbers is n?
-
0.30
-
140
-
500
-
140/500
8.) many biologist and anthropologist claim that 10 percent of all children conceived in the context of a marriage have been fathered by someone from outside the couple.
In this situation, the standard deviation from samples of 225 births is 0.02. If the sample size were decreased, the standard deviation would be
-
Smaller
-
Larger
-
The same
-
There is not enough information
7.) Experts have estimated that 25% of all homeless people in the U.S. are veterans. The proportion of Americans in general who are homes is 0.11. For random samples of 100 people, which is more normal?
-
Distribution of sample proportion, when the population proportion is 0.11
-
Distribution of sample proportion, when the population proportion is 0.25
-
Both are the same
-
None of the above
6.) The students at a local high school were assigned to do a project for their statistics class. The project involved having sophomores take a timed test on geometric concepts. The statistics students would then use these data to determine whether there was a difference between male and female performances. Would the resulting sets of data represents dependents or independent samples?
-
Dependent. The samples are taken from the same set of students.
-
Dependent. The samples are from two separate and different sets of students.
-
Independent. The two samples are from two separate and different sets of students.
-
Independent. The samples are taken from the same set of students.
5.) State the null hypothesis H0 and the alternative hypothesis Ha that would be used to test the following claim:
A chicken farmer at Best Brollers claims that the chickens have a mean weight of 56 ounces.
-
H0 = =56 vs Ha:56
-
H0=56 vs Ha:=56
-
H0==56 vs Ha:=56
-
None of the above
4.)
|
29 |
8 |
7 |
33 |
21 |
26 |
6 |
11 |
4 |
54 |
7 |
4 |
Use the point data to find a point estimate for the standard deviation.
-
Approximately 25.5
-
Approximately 15.5
-
Approximately 10.5
-
Approximately 5.5
3.) A certain population has a mean of 500 and a standard deviation of 30. Many samples of 36 are randomly selected and the means calculated. What value would you expect to find the mean of all these sample means?
-
36
-
500
-
500/36
-
None of the above
2.) Manufacturers use random samples to test whether or not their product is meeting specifications. These samples could be people, manufactured parts, or even samples during the manufacturing of potato chips. What characteristic (or property of random samples) could be observed during the sampling process?
-
Variability
-
Exactness
-
Randomness
-
None of the above
1.) Manufacturers use random samples to test whether or not their product is meeting specifications. These samples could be people, manufactured parts, or even samples during the manufacturing of potato chips. Do you think that all random samples taken from the sample population will lead to the same result?
-
Yes
-
No
-
Not enough data
-
None of the above
